


- This article explains which customer service KPIs belong in a travel support desk's weekly report and how to calculate each one when bookings, suppliers and disruption are involved.
- It's for heads of support and operations at OTAs, bedbanks, DMCs, TMCs and tour operators who run a weekly ops review.
The Monday report says ticket volume rose 18%, first response looks fine, and CSAT fell three points. Nobody in the room can say whether the desk had a good week. That usually isn't the team's fault. Most customer service KPIs were built for desks where demand doesn't follow bookings and no hotel holds part of the clock. This guide sets out 12 numbers for a travel desk's weekly report. For each one, you get a travel formula and the number to read beside it.
Why Generic Customer Service KPIs Misread a Travel Support Desk
A standard list of support metrics counts tickets, averages times and treats a closed ticket as finished. Each habit misreads travel work in a different way. Together, they explain why weekly reports so often start arguments instead of decisions.
Ticket volume follows bookings, so raw counts mislead
Contact volume in travel rises and falls with sales, so divide demand by what drives it.
A travel desk that takes 20% more tickets in a week with 30% more departures has improved, even though a raw ticket count reports a worse week.
Large operators already think this way. Booking Holdings' CFO told investors the group saw about a 10% decline in customer service cost per booking in 2025, as service costs fell and bookings grew.
Averaged support metrics hide the traveler who waited longest
Response times in travel are skewed. Most tickets move quickly, while a few wait overnight or sit with a supplier for days. In skewed data, the mean is pulled toward the long tail, so one average can describe almost no real ticket. That tail is where complaints start. In a CMAC Group survey of 1,100 UK travelers, passengers expected a reply within an hour during disruption but waited nearly two hours on average (2025).
Is a closed ticket a finished trip?
Often it isn't. An agent marks a hotel date change resolved on Tuesday. The fix is only proven when the traveler checks in three weeks later. If the hotel never updated its system, the same booking returns as a new, angrier ticket. Suppliers also hold the next step on much of the work, so "resolved" depends on people outside your team. Disruption adds one more problem. Unless storm or strike contacts carry their own tag, one bad week bends the trend for a month.
What Are Customer Service KPIs, and Which Belong in a Weekly Help Desk Report?
The weekly review is where you decide on rotas, suppliers and process. So it needs a short list of numbers, defined once and measured the same way every week.
Customer service KPIs vs help desk metrics
Customer service KPIs are the few support measures a team commits to. Each one has a target, a named owner and an agreed action when it misses, and each is reviewed on a fixed schedule, usually weekly. They're a small subset of help desk metrics, which cover everything a support system records.
Every KPI is a metric, but few metrics deserve to be KPIs. Here's the test: if this number turned red, would someone change a rota, call a supplier or fix a process?
A number belongs in the weekly report only if a red result would make someone act.
Five measurement rules for travel customer service metrics
Apply these rules before any number reaches the report:
- Report time metrics as a median and a 90th percentile, never as an average alone.
- Measure messaging channels in calendar hours. After all, 73% of consumers expect a reply on social media within 24 hours or sooner (Sprout Social, 2025).
- Show supplier pending time apart from your team's time.
- Express demand per 100 bookings or departures.
- Tag disruption contacts so they sit in their own column.
What stays out of the weekly support report?
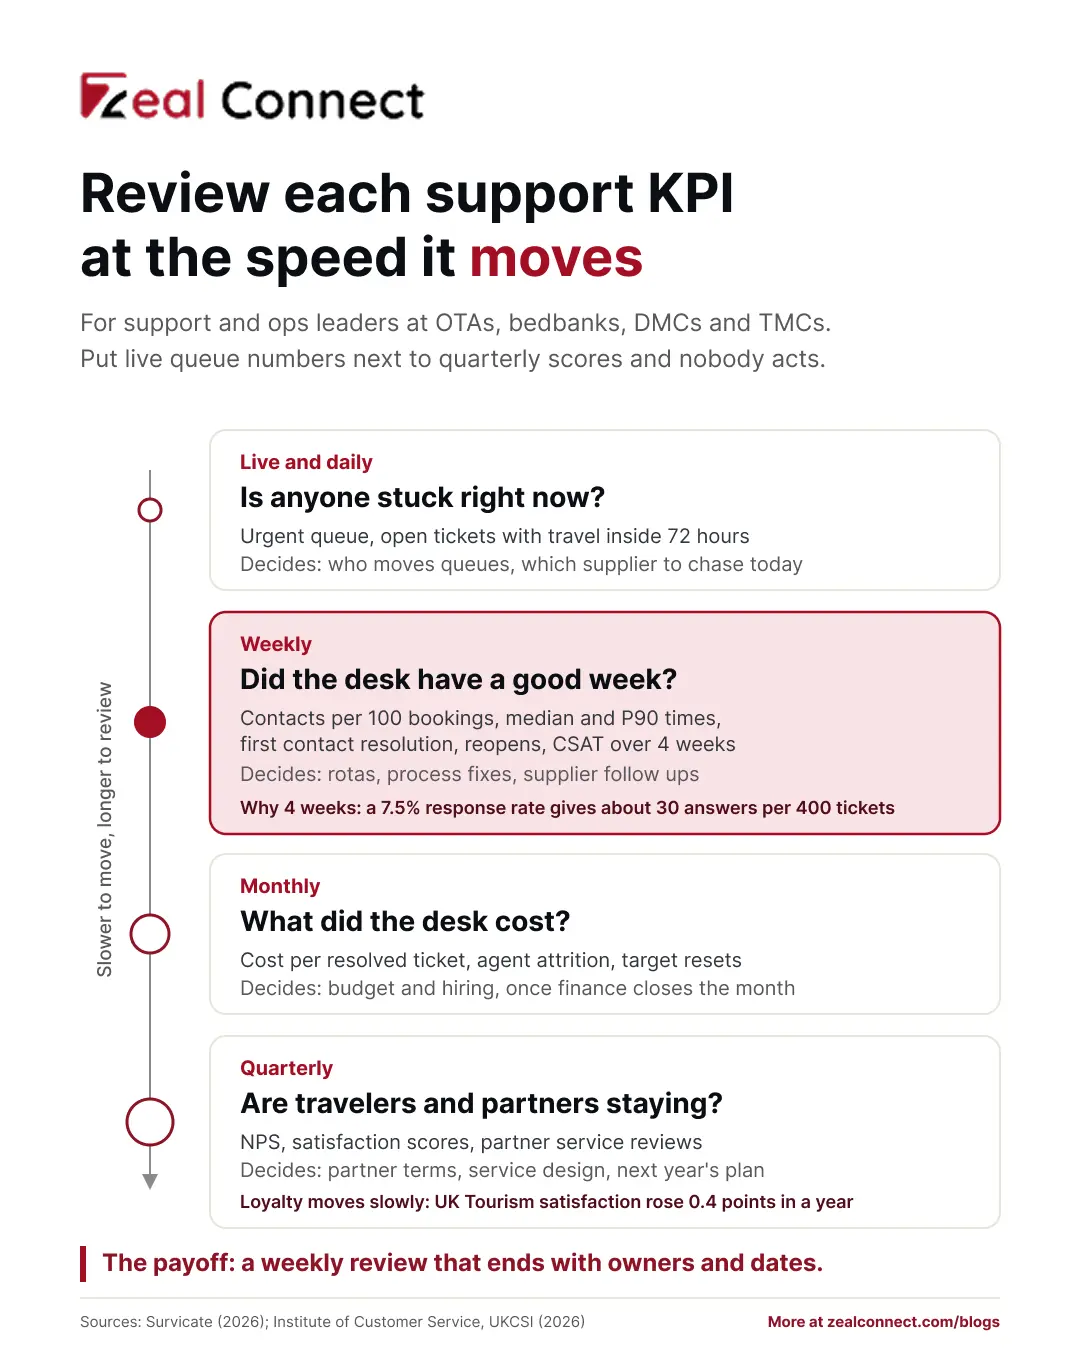
Relationship and finance numbers belong in the monthly or quarterly pack. Loyalty scores such as NPS move slowly. The UK Tourism sector's satisfaction index, for example, rose 0.4 points in a year to 80.9 (Institute of Customer Service, 2026). A weekly swing of three points is noise or a shift in contact mix. Cost per resolved ticket waits for finance's monthly close, since it divides total operating cost by ticket volume. Attrition and partner reviews follow the same calendar.
Key Terms Worth Knowing
A few terms come up throughout this article on customer service KPIs for travel desks. Here is what each one means.
- Contacts per 100 bookings: new support requests divided by bookings or departures in the same period, times 100. It shows whether support demand grows faster than sales.
- Agent owned time: the part of a ticket's life when the next step sits with your team. It leaves out any time spent waiting on a supplier.
- Supplier pending time: time a ticket waits while a hotel, airline, bedbank or ground handler holds the next step. Report it by supplier.
- P90 (90th percentile): the time that 9 in 10 tickets beat. It shows the slow tail an average hides.
- FCR eligibility: the rule for which contacts count toward first contact resolution. Contacts that need a supplier to act first are reported separately.
- Disruption tag: a label on every contact caused by one event, such as a strike or schedule change. It keeps that demand apart from normal weeks.
The 12 Customer Service KPIs Travel Support Leaders Report Weekly
These 12 customer service KPIs cover three things: what the week asked of the desk, how fast the team moved, and whether the work stayed done. Calculate each one the same way every week, so a change on the report means a change on the desk.
Table: The 12 weekly customer service KPIs for a travel support desk
Demand and backlog KPIs: what the week asked of the desk
Start the report with demand, because every other number depends on it. Contacts per 100 bookings shows whether the desk absorbs more work per sale. The reason cut then shows why. Count one contact per new request, not per message, or a long WhatsApp thread inflates the figure. The travel date backlog matters more than the total.
A backlog of 300 can be fine, while 40 open tickets departing tomorrow is a real risk.
Speed KPIs: separate your team's clock from the supplier's
Split SLA attainment into at least three tiers: urgent travel inside 72 hours, partner contracts and standard requests. Otherwise a strong week on easy email hides a weak week on urgent cases. For resolution time, pause the team clock while a ticket waits on a supplier. Then report that wait by supplier. Your team's number shows what it controls, and the supplier list becomes evidence for supplier reviews.
How do you measure outcome KPIs when a supplier has to act first?
Measure first contact resolution only on contacts your team can finish alone, and show supplier dependent ones as a separate figure. SQM Group puts the call center industry average for first call resolution at 71% (2026). That is a mostly voice, cross industry reference, not a travel target. CSAT needs care too, because the median CSAT survey response rate is 7.5% (Survicate, 2026).
At a 7.5% response rate, 400 resolved tickets bring about 30 CSAT answers, so report CSAT on a rolling four weeks with the count beside it.
How to Read Help Desk Metrics in Pairs: One Week on a Travel Desk
A single KPI can improve while the desk gets worse. That's why the table has a "Read it with" column. The illustrative example below follows a mid size company selling hotels to trade partners and packages to travelers. Its numbers are an example, not a benchmark.
The week first response time halved
The team added a morning triage rota. Median first response on email fell from about three hours to 50 minutes, which looked like a great week. Yet the reopen rate rose from 7% to 12%, and first contact resolution slipped four points. A sample of tickets explained it. Many fast replies said "we're checking with the hotel" and nothing more, so travelers wrote back. The desk got faster without getting more useful, and the pair showed it within a week.
The week contacts per 100 bookings jumped
A week later, contacts per 100 bookings rose from 14 to 19 while bookings stayed flat. A raw count would have pointed to staffing. Instead, the reason cut showed "voucher not received" contacts had doubled. A new confirmation email was landing in spam, so the fix belonged to the product team. Large operators see the same effect. Airbnb told shareholders that cancellation policy changes helped to reduce customer service contacts in Q4 2025.
Which help desk metrics catch a gamed number?
Start with first response time and reopen rate. When replies get faster while reopens climb, the replies are empty. Rising first contact resolution beside rising reopens usually means tickets close too soon. And if an agent's resolved tickets per hour climb as their CSAT falls, check whether they pick easy tickets first.
No number earns praise or blame until its pair has been read.
Building the Weekly Help Desk Report: Layout, Targets and the Review
Once the numbers and pairs are agreed, the weekly help desk report can stay short. One page holds all 12 KPIs, as long as every row uses the same layout.
One page, five columns for every support KPI
Give each KPI one row and five columns: this week, the four week trend, the target, the owner and the disruption tagged share. That last column stops a strike week from reading as a decline. Then cut the key rows by channel, desk and customer type. Trade partners and corporate clients judge you on their own SLAs. In a GBTA poll, 30% of travel buyers were reviewing their TMC, and 37% of those cited service quality (2025).
How should you set customer service KPI targets when travel benchmarks are scarce?
Set targets from your own baseline, because published travel benchmarks for support KPIs are rare.
Set each customer service KPI target on the median of eight to twelve normal weeks of your own data, leaving out tagged disruption weeks.
Averages mislead here as well. In MetricNet's 2023 IT service desk data, the average cost per email ticket was $24.24, but the median was $19.96. A few expensive desks pulled the average up.
Run the review in a fixed order and leave with one action per owner
Read the report in the same order each week: demand, backlog, speed, outcomes, then experience. Demand goes first because it explains most of what follows. Spend the meeting on the two or three pairs that moved outside their normal range. Every red number leaves with one owner, one action and a date. If a number stays red for three weeks with no action, it needs a new owner or a place off the report.
Conclusion
Generic customer service KPIs miscount travel work in predictable ways. Volume follows bookings and escalations sit in the slow tail. Suppliers hold part of the clock, and one disruption week can bend a month of trends. Twelve numbers with travel formulas correct most of that, as long as each is read beside its pair. The report itself can be short. It needs demand per 100 bookings, a travel date backlog, medians and P90s, supplier time shown apart, and outcomes that run to the travel date. Rebuild next Monday's report on this layout and run it for four weeks. Only then set new targets from your own baseline.
Frequently Asked Questions
What are the most important customer service KPIs for a travel company?
Start with contacts per 100 bookings, first response time, SLA attainment by tier, first contact resolution, reopen rate and CSAT. Contacts per booking comes first, because it shows whether support demand grows faster than sales. Add agent owned resolution time and supplier pending time if hotels, airlines or bedbanks hold the next step on your work.
How do you calculate contacts per booking?
Divide new support requests in a week by bookings made that week, then multiply by 100. If most contacts come close to travel, divide by departures instead. Count one contact per new request, not per message or channel. Otherwise a long WhatsApp thread or a follow up email inflates the number.
Should time waiting on a supplier count against our SLA?
Report both views. The traveler feels the total time, so total resolution time stays on the report. Your team controls only its own share. So pause the team clock while a ticket waits on a hotel, airline or bedbank, and report that wait by supplier for your supplier reviews.
What is a good first contact resolution rate for a travel desk?
There is no reliable public benchmark for travel. SQM Group's cross industry call center average is 71%, but travel runs lower when a supplier must act first. Report FCR for contacts your team can finish alone and show supplier dependent ones separately. Then set a target from eight to twelve weeks of your own data.
How often should help desk reporting happen: daily, weekly or monthly?
Use all three for different jobs. A live or daily view manages the queue and urgent travel. The weekly report carries the 12 KPIs and drives decisions on rotas, process and suppliers. Monthly and quarterly packs hold cost per resolved ticket, NPS, agent attrition and partner service reviews.